Has Texas Instruments Incorporated's (NASDAQ:TXN) Impressive Stock Performance Got Anything to Do With Its Fundamentals?
Most readers would already be aware that Texas Instruments' (NASDAQ:TXN) stock increased significantly by 7.2% over the past month. We wonder if and what role the company's financials play in that price change as a company's long-term fundamentals usually dictate market outcomes. In this article, we decided to focus on Texas Instruments' ROE.
Return on Equity or ROE is a test of how effectively a company is growing its value and managing investors’ money. Simply put, it is used to assess the profitability of a company in relation to its equity capital.
View our latest analysis for Texas Instruments
How Do You Calculate Return On Equity?
Return on equity can be calculated by using the formula:
Return on Equity = Net Profit (from continuing operations) ÷ Shareholders' Equity
So, based on the above formula, the ROE for Texas Instruments is:
54% = US$8.3b ÷ US$15b (Based on the trailing twelve months to March 2023).
The 'return' refers to a company's earnings over the last year. So, this means that for every $1 of its shareholder's investments, the company generates a profit of $0.54.
What Is The Relationship Between ROE And Earnings Growth?
So far, we've learned that ROE is a measure of a company's profitability. Based on how much of its profits the company chooses to reinvest or "retain", we are then able to evaluate a company's future ability to generate profits. Generally speaking, other things being equal, firms with a high return on equity and profit retention, have a higher growth rate than firms that don’t share these attributes.
Texas Instruments' Earnings Growth And 54% ROE
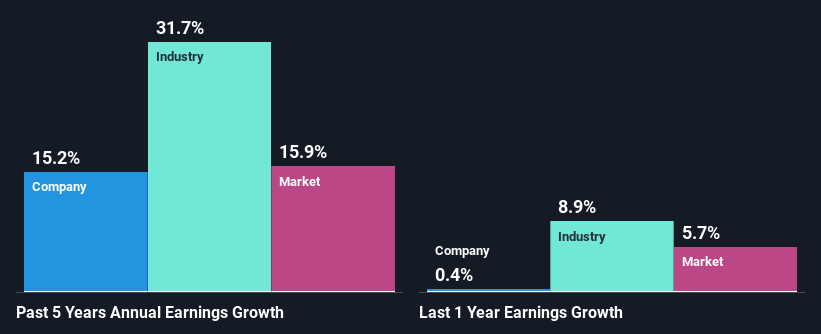
First thing first, we like that Texas Instruments has an impressive ROE. Second, a comparison with the average ROE reported by the industry of 16% also doesn't go unnoticed by us. Probably as a result of this, Texas Instruments was able to see a decent net income growth of 15% over the last five years.
Next, on comparing with the industry net income growth, we found that Texas Instruments' reported growth was lower than the industry growth of 32% in the same period, which is not something we like to see.
Earnings growth is a huge factor in stock valuation. It’s important for an investor to know whether the market has priced in the company's expected earnings growth (or decline). Doing so will help them establish if the stock's future looks promising or ominous. If you're wondering about Texas Instruments''s valuation, check out this gauge of its price-to-earnings ratio, as compared to its industry.
Is Texas Instruments Using Its Retained Earnings Effectively?
While Texas Instruments has a three-year median payout ratio of 53% (which means it retains 47% of profits), the company has still seen a fair bit of earnings growth in the past, meaning that its high payout ratio hasn't hampered its ability to grow.
Additionally, Texas Instruments has paid dividends over a period of at least ten years which means that the company is pretty serious about sharing its profits with shareholders. Our latest analyst data shows that the future payout ratio of the company is expected to rise to 65% over the next three years. Accordingly, the expected increase in the payout ratio explains the expected decline in the company's ROE to 43%, over the same period.
Summary
Overall, we feel that Texas Instruments certainly does have some positive factors to consider. Its earnings have grown respectably as we saw earlier, which was likely due to the company reinvesting its earnings at a pretty high rate of return. However, given the high ROE, we do think that the company is reinvesting a small portion of its profits. This could likely be preventing the company from growing to its full extent. With that said, the latest industry analyst forecasts reveal that the company's earnings growth is expected to slow down. To know more about the latest analysts predictions for the company, check out this visualization of analyst forecasts for the company.
Have feedback on this article? Concerned about the content? Get in touch with us directly. Alternatively, email editorial-team (at) simplywallst.com.
This article by Simply Wall St is general in nature. We provide commentary based on historical data and analyst forecasts only using an unbiased methodology and our articles are not intended to be financial advice. It does not constitute a recommendation to buy or sell any stock, and does not take account of your objectives, or your financial situation. We aim to bring you long-term focused analysis driven by fundamental data. Note that our analysis may not factor in the latest price-sensitive company announcements or qualitative material. Simply Wall St has no position in any stocks mentioned.
Join A Paid User Research Session
You’ll receive a US$30 Amazon Gift card for 1 hour of your time while helping us build better investing tools for the individual investors like yourself. Sign up here
