WhaleStream’s Market-Tracker Analysis Tool provides further insight into the Dark Pool prints & Option Flow that has come in on the symbol.
WhaleStream’s Market-Tracker Analysis Tool provides further insight into the Dark Pool prints & Option Flow that has come in on the symbol.
How do you access the Market-Tracker Tool?
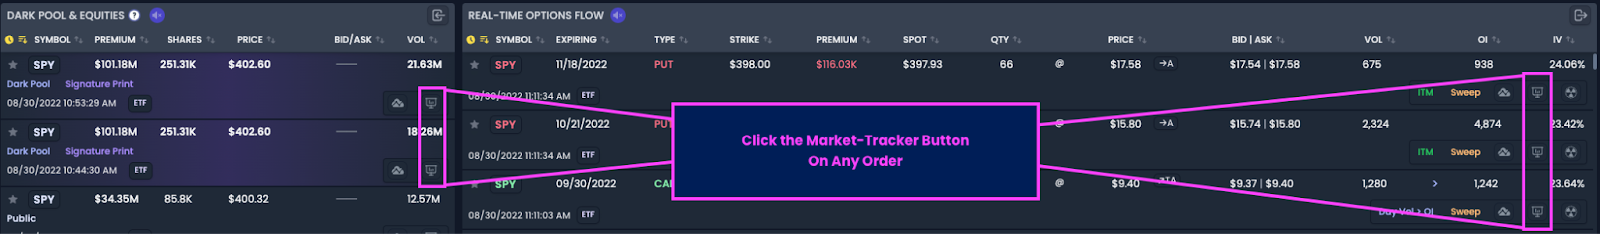
There are multiple ways to get to the Market-Tracker Tool: 1. On your dashboard, you can click the market-tracker button that is included on every Options Flow and Dark Pool Order. (Currently unavailable for Indexes). Clicking the button from an order will bring up the Market-Tracker for the Underlying symbol of the order you clicked on.
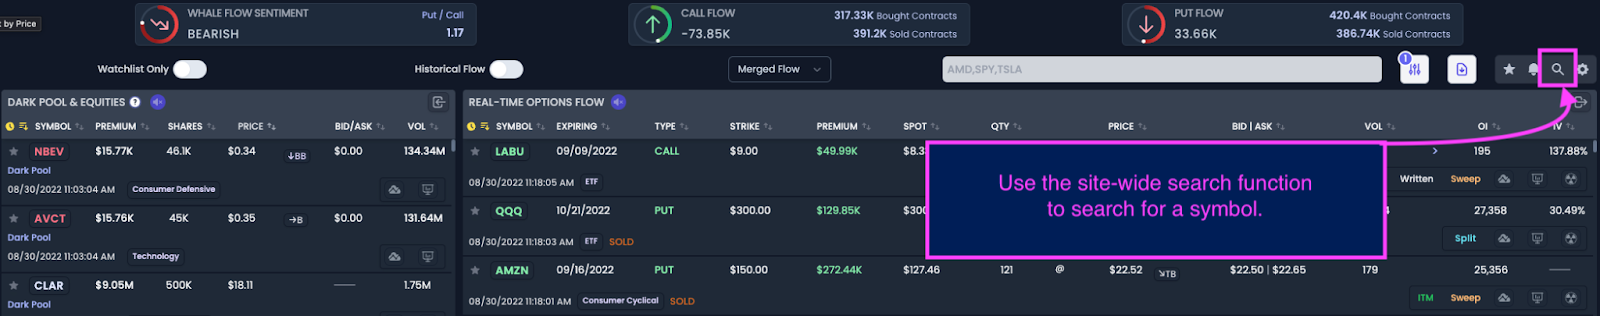
2. Click the Magnifying Glass to use the WhaleStream Site-Wide search function to search for a symbol. You can also use ⌘+K (Mac) or CTRL+K(PC) to open the search.
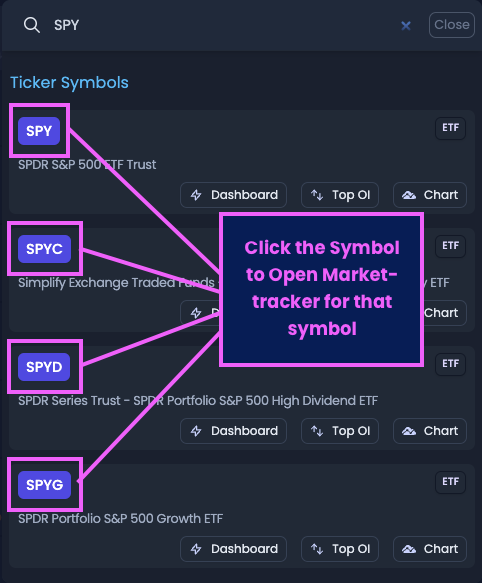
When the search pops up, just type the symbol in the search bar at the top and then click the symbol button to view the market-tracker for that symbol.
Now that you know how to get to the Market-Tracker Dashboard, Let’s Explore!
Quote & Underlying Chart With Dark Pool & Equity Print Levels Plotted as Support and Resistance Levels.
At the top of the page, you will be presented with the Symbol Quote with some additional information like: Sector and Upcoming Earnings Dates. Directly below that, is the Underlying Chart With Dark Pool & Equity Print Levels Plotted as Support and Resistance Levels. This chart includes the strongest and closest levels above and below the current stock price. Dark Pool Prints often act as key levels of support and resistance because they represent price levels that smart money institutions have historically bought and sold large quantities of shares.
Most Active Option Strike Price Buys & Sales
Quickly identify the most active strikes that whales have been buying and selling over the past 5 trading days. Currently, this includes all expiration dates, but will soon have added granularity to allow you to focus on specific date ranges and adjust the amount of trading days that the premiums will reflect.
View the strongest levels above and below the current spot price. Spot price plotted in pink to see where the next strongest support and resistance levels could be based on total premium. Each bar represents the cumulative premium of dark pool and equity prints that hav been executed at that exact trade price. Click Here for more information on Dark Pools and how they work.
Visually see the total Open Interest over the past few weeks and how the OI has changed. Dates represent the date that the OI was reported and the OI values are based on ALL strikes and ALL expirations within the underlying's option chain. Want more info on Open Interest and how it works? Click Here to check out this detailed write up on Open Interest.
See a list of Large Institution's Holdings of the Underlying asset.
Relevant News
Quickly scan through the most recent new articles pertaining to the underlying Symbol and other news that may have a direct or indirect impact on the underlying.